
Fact Check
The MP argued at a press conference that Sri Lanka’s tax policies don’t take adequate account of the huge inequality existing among Sri Lankan citizens, when designing the distribution of the tax burden. In support of this larger argument, he provided the above statistics highlighting inequality.
To check this claim, FactCheck.lk consulted the World Inequality Database (WID) and the 2019 Human Development Report (HDR) by the UNDP. The most recent figures are reported for 2022.
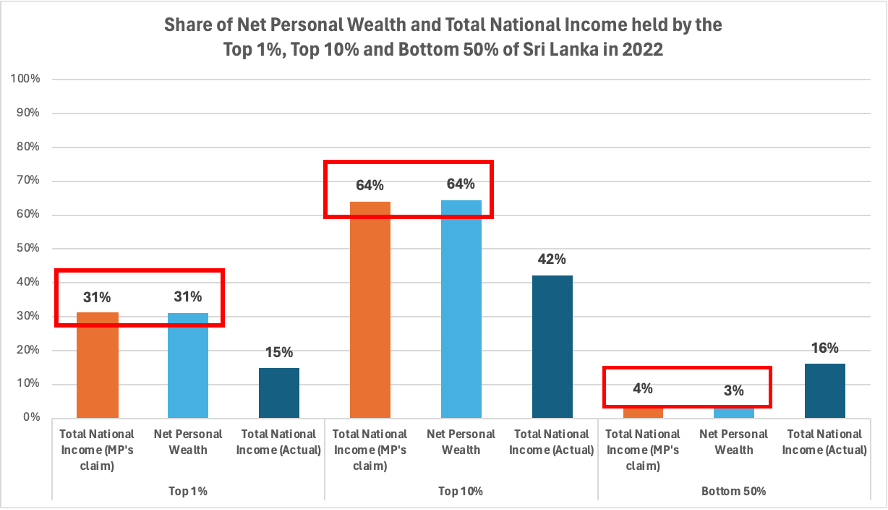
According to the available data, the distribution of national income in Sri Lanka is different from the figures cited by the MP, and the inequality of income is notably less than what is cited. The top one percent are recorded as having received 15% of the total income, and not 31% as cited by the MP. Likewise, the top ten percent received only 42%, not 64% of the income, and the bottom fifty percent received 16% and not just 4% of the income.
In attempting to understand how the MP had arrived at his numbers, FactCheck.lk found that the MP had cited figures related to wealth inequality in Sri Lanka, and not income inequality.
Inequality can be quantified both in terms of income or wealth across different strata of society; but they are quite different measures/statistics. According to the HDR, income is measured as wages, salaries, profits, and earnings over a given period. By contrast, wealth is measured as the total current value of accumulated assets owned by individuals (e.g., savings, properties, investments) minus all debts.
It’s possible for a person to be wealth-rich and income-poor (e.g. a government pensioner living on a valuable inherited property). Likewise, it is possible to be income-rich and wealth-poor (e.g. a young stockbroker that does not own any land or vehicles).
The MP’s cited figures align with the distribution reported of net personal wealth across society, and not the distribution of total national income as he claimed (see Exhibit 1). Overall, the MP is setting out to highlight inequality in society, and arguing for taxes that take more from those who are better off and less from those who are worse off. Wealth inequality that he cites correctly (though mislabeling it as income inequality) is an important measure of inequality and a valid focus of tax policy. The MP’s statement is not correct, as he mislabels the “wealth” inequality statistics as “income” inequality statistics. However, if correctly labelled that statistic on wealth inequality does support the argument he is making.
Therefore, we classify the MP’s statement as PARTLY TRUE.
Exhibit 1: Share of Net Personal Wealth and Total National Income held by the 1 Top 1%, Top 10% and Bottom 50% of Sri Lanka in 2022