

Fact Check
In his statement, the MP makes two related claims:
- Economic activity is skewed towards the Western Province (WP) and the North Western Province (NWP) compared to more rural provinces, such as the North Central Province (NCP).
- Those living in areas with relatively lower economic activity have less opportunity to participate in the economy (and benefit from it).
To evaluate these claims, FactCheck.lk consulted the latest available data from 2021 from the Central Bank of Sri Lanka (CBSL) and the Sri Lanka Labour Force Survey (LFS).
Claim (i): CBSL data shows that in 2021, the WP generated 42.6% of the national GDP and the NWP generated 11.1%. Both these numbers are even higher than what the MP claimed, and the disparity cited is also higher, because the NCP generated 4.9%, in line with the MP’s claim. That is, WP and NWP respectively generated 8.7 times and 2.3 times the output generated by the NCP.
These figures reflect the extent of disparity in economic output between geographic areas, not the disparity in economic participation of people in those areas. This is because the population in numbers also vary, and people can have jobs outside of their province.
Claim (ii): To evaluate economic participation, FactCheck.lk considered the economic output per employed person between provinces. Exhibit 1 shows that the output generated per employed person in WP was only 1.9 times that of the NCP, and that of the NWP was only 1.1 times that of the NCP. Therefore, the disparity between provinces in economic output per employed resident is very small, despite the geographic disparity in economic output.
FactCheck.lk also considered unemployment rates and the percentage of working-age people who were employed. Exhibit 1 shows that unemployment was worse in WP than in NCP and NWP, and the percentage of working-age persons that were employed was also lower in WP than in NCP and NWP. Therefore, the data is significantly at odds with claim 2.
Despite some incorrect data, the MP is correct about the geographic disparity in economic output between WP, NWP and NCP. However, by not adjusting for population and for employment status, he has mistakenly interpreted the geographic disparity as reflecting the human disparity in economic participation.
Therefore, we classify the MP’s statement as PARTLY TRUE.
*FactCheck.lk’s verdict is based on the most recent information that is publicly accessible. As with every fact check, if new information becomes available, FactCheck.lk will revisit the assessment.
Exhibit 1: GDP and Employment Indicators by Province
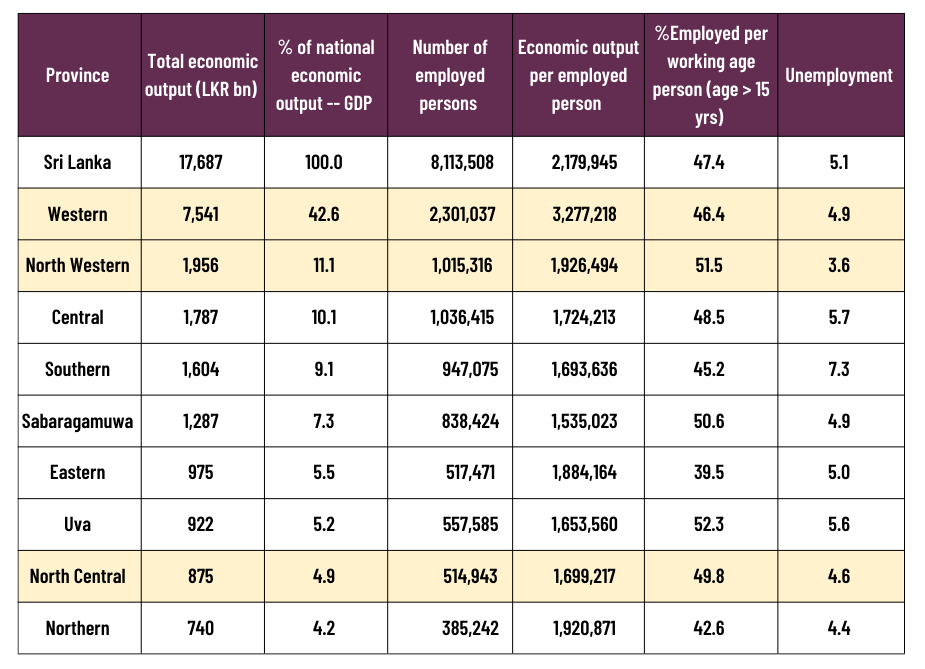
Source: CBSL Provincial Gross Domestic Product (PGDP) – 2021, LFS Annual Report – 2021
Additional Note
Unemployment measures the percentage of people available and or looking for work opportunities who were not employed.
Sources
CBSL Provincial Gross Domestic Product (PGDP)– 2021, available at; https://www.cbsl.gov.lk/en/node/13764 [Last accessed 02 March 2023]
LFS Annual Report – 2021, available at; http://www.statistics.gov.lk/LabourForce/StaticalInformation/AnnualReports [Last accessed 02 March 2023]